
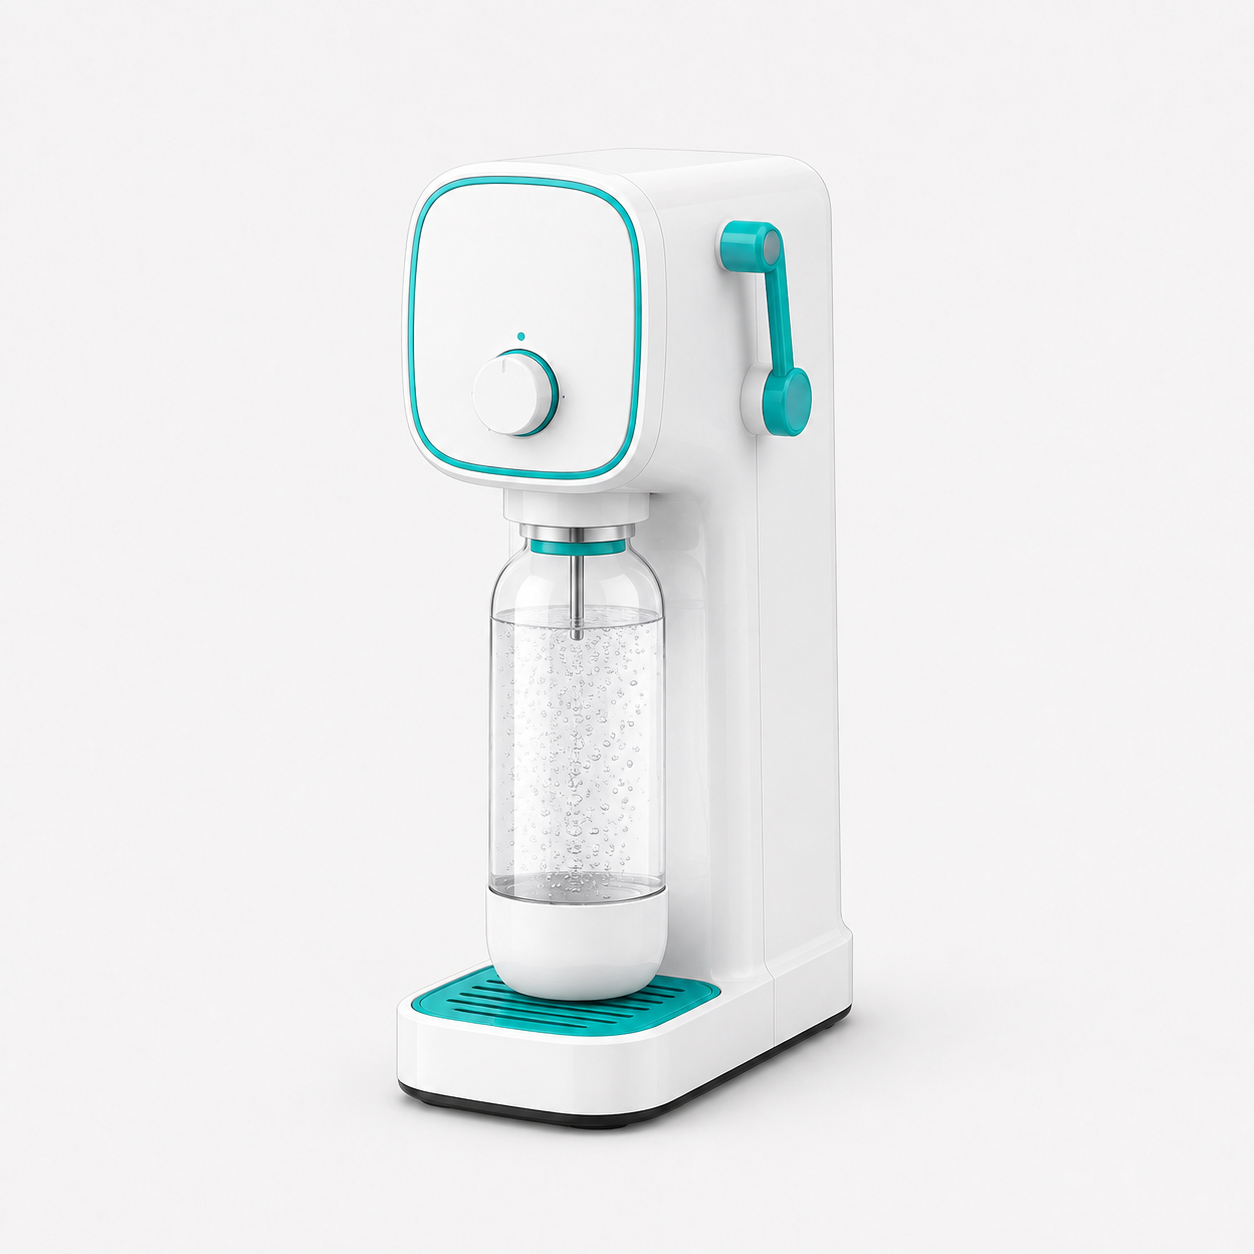
AI-generated illustration. Not an exact product image.
{acpt_meta_box_title_tech}
SodaStream
CRYSTAL 3.0
Typical price paid
—
Still using
0%
At least monthly
Would buy again
0%
Regret
100%
2
responses
Very limited data
Usage over time
How often owners still use it
Usage frequency reported by owners of this product.
|
Daily |
0% |
|
Several times a week |
0% |
|
Weekly |
0% |
|
Monthly |
0% |
|
Rarely |
0% |
|
Never |
100% |
How usage changed
Compared with when owners first got the product.
|
Use it more now |
0% |
|
About the same |
0% |
|
Use it less now |
100% |
Usage by ownership time
How continued use differs depending on how long owners have had the product.
|
2–5 years |
|
Based on 2 owners
Value & price
Worth the price?
Whether owners feel the product was worth what they paid.
|
Yes |
0% |
|
Partly |
0% |
|
No |
100% |
Why usage declined
HIER DEINEN BISHERIGEN SHORTCODE FÜR „WHY OWNERS USE IT LESS“
Product context
Product or product type?
Whether owners would choose this exact product again — or still want this kind of product at all.
|
Would buy this product again |
0% |
Based on 2 valid responses
|
Would buy this type of product again |
100% |
Based on 2 valid responses
How to read this page?
UsedLater? focuses on what happens after the purchase.
“Still using it” shows whether owners continue to use the product at least monthly.
“Would buy again” reflects hindsight, while “Regret rate” shows how many owners wish they had not bought it.
Response counts matter: small samples are useful as early signals, not firm conclusions.
⇄ Compare with similar products
Regret rate
Share of owners who say they regret buying this product.
|
Owners who regret buying it |
100% |
Would buy again
Share of owners who say they would buy this product again.
|
Owners who would buy it again |
0% |
Product or product type?
Whether owners would choose this exact product again — or still want this kind of product at all.
|
Would buy this product again |
0% |
Based on 2 valid responses
|
Would buy this type of product again |
100% |
Based on 2 valid responses
Usage by ownership time
How continued use differs depending on how long owners have had the product.
|
2–5 years |
|
Based on 2 owners
Still using it
Share of owners who still use this product at least monthly.
|
Owners still using it |
0% |
How usage changed
Compared with when owners first got the product.
|
Use it more now |
0% |
|
About the same |
0% |
|
Use it less now |
100% |
How often owners still use it
Usage frequency reported by owners of this product.
|
Daily |
0% |
|
Several times a week |
0% |
|
Weekly |
0% |
|
Monthly |
0% |
|
Rarely |
0% |
|
Never |
100% |
Why owners use it less
Reasons reported by owners who reduced or stopped using it.
|
Broke or stopped working |
100% |
|
Replaced by another product |
50% |
Worth the price?
Whether owners feel the product was worth what they paid.
|
Yes |
0% |
|
Partly |
0% |
|
No |
100% |
Data basis
How much owner experience currently supports the statistics above.
|
2 responses |
Very limited data |
Share your experience
Sign in to share your experience
One account helps us make sure each person contributes only one active response per product.